

Volatility Index 75 and Trendlines
Volatility index 75 can traded profitably by drawing Trendlines from one extreme high or low point to another extreme high or low point.
This page will show readers and followers how to plot Trendlines on the V75 chart using different time frames.

Traders can place trades, set take profit and Stop loss on Trendline breakout and price rejection.
(You can use Volatility Index 75 Scalper, Scalper 2, Scalper 3, Scalper 4, Mulilo, Iyanu and Zuri strategy for scalping V75).
(Binary dot com also known as Deriv dot com is the only broker that has Volatility Index 75).
Sign up via this link to open V-75 Index trading account…https://track.deriv.com/_WxWzztorkVi2vdm9PpHVCmNd7ZgqdRLk/1/) Contact Ducoy on telegram for free account opening assistance https://t.me/joinchat/AAAAAE97zaWdZg5KBbrIVQ
SPECIAL OFFER: If you register/open binary account via the referral link, daily profitable signals await you as soon as you fund the account.
(Contact Ducoy on telegram to be added to a private telegram signal group as soon as your newly opened account is funded).
https://track.deriv.com/_WxWzztorkVi2vdm9PpHVCmNd7ZgqdRLk/1/
Contact Ducoy on telegram for more info.

BTC: 3Lrsk2Qzmoi1w1MwHvUL5ooqUJKbKU
For your Bitcoin Transactions, think LUNO … hit the link to sign up https://www.luno.com/invite/KQRSXS
Check Out:
BeanFX Volatility Index 75 Scalper
How To Setup A Demo Trading Account – Strictly For Beginners!
Build Your Own Expert Advisor Online (Free)
BeanFX Nasdaq 100 Index Scalper
V75 1HR CHART…4TH JAN 2020 (13:54 GMT)

V75 1HR CHART…4TH JAN 2020 (09:52 GMT)

V75 1HR CHART…4TH JAN 2020 (00:12 GMT)

V75 1HR CHART…1ST JAN 2020 (09:30 GMT) IN RANGE MODE…RECENT BOUNCE ON ASCENDING TRENDLINE.

How Plot Trendlines
Trendline object tool can be selected on the MT5 chart as shown in red circles in the image below;

One can plot trendlines from one extreme low point to another as shown below;

The two extreme low points are now connected as shown in image below, However, the trendline projects further to predict possible future price low points.

This process is repeated for the extreme high points as well. The Trendline is always dragged from left to the right as shown below;


Technically, trendlines can connect two extreme high points to predict possible price future high points.
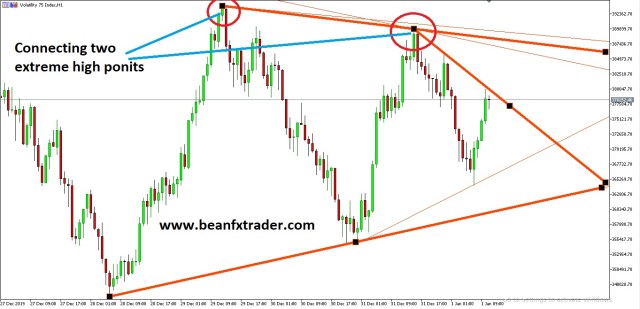

Remember, when plotting trendlines from one extreme point to another, always drag the trendline from the left side of the chart to the right.
Development of candlestick price reversal patterns is very important when spotting price reversals or swings on ascending or descending trendlines.


Price continuation usually happens most of the time on trendline breakout. Price break and close above or below ascending or descending trendlines usually signal trend continuation.


At times, one gets a trendline breakout, retest and trend continuation;


Referral links;
(Broker: Binary…https://record.binary.com/_WxWzztorkVi6tyDIijdDK2Nd7ZgqdRLk/1/)
(Broker: Alpari … https://alpari.com/en/?partner_id=1244646)
(Broker: Exness … https://www.exness.com/a/t0q1u0q1)
(Broker: FXTM… http://forextime.com/?partner_id=4806145)
(Email: beanfxtrader@gmail.com)
(Telegram: https://t.me/joinchat/ETY7gFHPyzjSljRGwI841Q)
|
|||||||
Please send me signals.
Join here https://t.me/joinchat/ETY7gFHPyzjSljRGwI841Q
You are a living Legend Boss, Keep up the good work
I also want to join for signals and online course if possible
Please join here…https://t.me/joinchat/ETY7gFHPyzjSljRGwI841Q