Bollinger Bands (technical analysis tools) are created by John Bollinger and used to measure market volatility (sometimes used for scalping strategy) because they adjust to market conditions. Traders use the bands to confirm trends, market range top, and bottom.

Bollinger bands can confirm the range of price action and they donโ€™t lag like other indicators. They simply define the path of price action. The center line at the middle of the Bands is a 20-period moving average. It is also unique among moving average periods.


Volatility

In the time of volatility and when there is a strong trend, (when price breaks out of a range) market price will spike through the Outer Bands and lap with it vertically (this is known as Riding the bands). At this point, scalpers come in for some few pips.
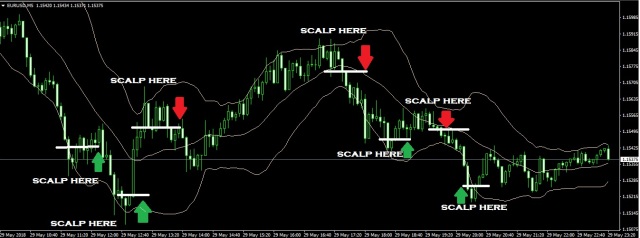
BOLLINGER BAND

Consolidation

In the time of consolidation (Bollinger squeeze), the market price ranges from one Outer Bollinger Band to another. Price moves from upper band to the lower band and vice versa. Scalpers enter sell trades at the upper band and enter buy trade at the lower outer band.

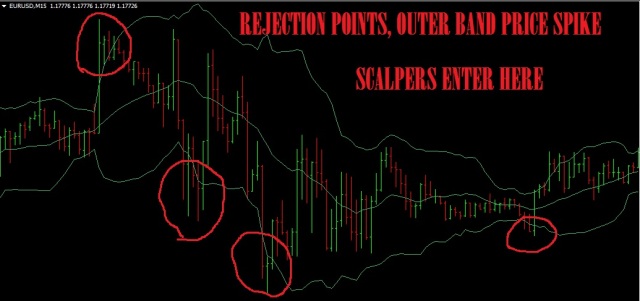
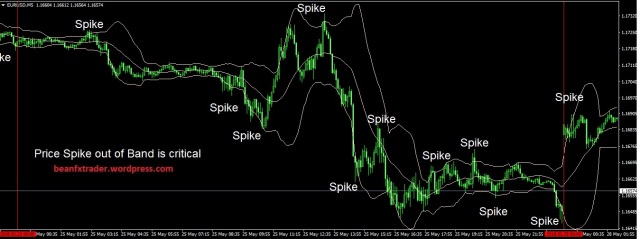
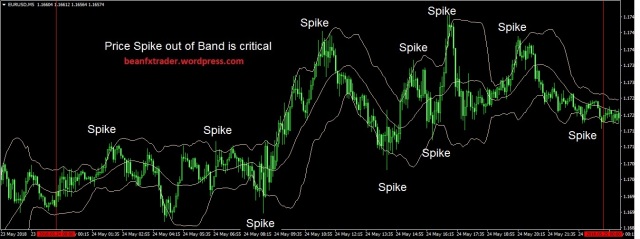
Price Rejection (Spikes)

Price Rejection occurs on the Outer band sometimes, especially when price spikes out of the Bollinger Band and forms a wick across the Outer line externally. Scalpers benefit from this type of spike as price may either reverse the trend or continue the trend.

Spikes normally occur after the release of a high impact news. It occurs when the market buys the rumor and sells the factย shortly after. Price rejection also occurs when the real facts about the news release or economic data release (fundamentals) change market sentiment.

Scalpers hunt for spikes at the top of every time change on the chart. Swing traders hunt for spikes at the top of higher time frames (4hr, daily). While position traders hunt for spikes at the top of the highest time frames (weekly, monthly).

Market price is said to be overbought when it continually touches the upper Bollinger Band. Price isย oversold when it continually touches the lower Bollinger Band.

Click here to read on how to scalp.

BOLLINGER BAND2
spikelee1.jpg
BOLLINGER BAND3
BOLLINGER.jpg

Practically, here is the short video of compiled screenshots of catching a spike out of Bollinger Bands. The idea is, as price breakout of the Outer Band, it is rejected at some point, (and at the point of rejection, spike catchers hop in for a ride – few pips (between 2 to 10 pips) are booked quickly with fast fingers).

spikelee.jpg
BOLLINGER band and scalp3.jpg
BOLLINGER band and scalp2.jpg

Bollinger

Bollinger

Bollinger

Bollinger

Bollinger

Bollinger

The combination of 10 and 13 Simple Moving Averages also give possible price potential direction. When both moving averages crosses above the mid Bollinger band, this indicate a potential bullish price movement.

However, when both crosses down on the mid Bollinger band, then there is room for bearish price movement. See image below.

Bollinger

Bollinger Band Settings

Bollinger

Check Out

Support and Resistance

LONDON BREAKOUT STRATEGY FOR GBP PAIRS

ELLIOTT WAVE PRINCIPLE

Introducing The Beandicator Signal!

Introducing the Pips-Beantrapper Indicator!

Achievable End Of Year Target For Newbies

DAILY TOKYO SESSION TRADE IDEA

SCOPE FOR TUE 9ย JULย 2019:

Bollinger Bands and Scalping Strategy (MON 23:42 GMT):

The following pairs are currently forming spikes out of Bollinger Outer Bands. Signaling a SELL or BUY: USDCHF, USDCAD, EURAUD, EURCHF, GBPCHF, GBPJPY, EURCAD, GBPCAD, GBPNZD (buy signal)ย  EURUSD, AUDUSD, XAUUSD (sell signal) see Daily chart for more details.


SCOPE FOR MON 8ย JULย 2019:

Bollinger Bands and Scalping Strategy (SAT 19:42 GMT):

The following pairs are currently forming spikes out of Bollinger Outer Bands. Signaling a SELL or BUY: ย USDCHF, USDJPY, CADJPY, AUDCHF, CADCHFย (buy signal)ย  EURUSD, CHFJPY, XAUUSD, NZDCAD, NZDUSD (sell signal) see Weekly chart for more details.ย  USDCHF, USDJPY, AUDNZD, CADCHF, GBPNZD (buy signal)ย  EURUSD, CHFJPY, EURCAD (sell signal) see Daily chart for more details.

SCOPE FOR MON 1 JULย 2019:

Bollinger Bands and Scalping Strategy (SAT 18:13 GMT):

The following pairs are currently forming spikes out of Bollinger Outer Bands. Signaling a SELL or BUY: EURUSD, EURGBP, CHFJPY, NZDUSD, AUDUSD, NZDCHF, XAUUSD (buy signal) USDCHF, USDCAD, EURCHF, GBPCHF, AUDNZD, EURNZD, EURCAD, GBPAUD, GBPCAD, USDZAR, DXY, GBPNZD (sell signal) see Monthly chart for more details.ย  USDCHF, AUDUSD, EURGBP, EURJPY, CADJPY, GBPJPY, AUDNZD, AUDCAD, AUDJPY, CHFJPY, NZDJPY, NZDUSD, NZDCAD, NZDCHF, NZDSGD, USDMXNย  (buy signal) EURUSD, EURAUD, EURNZD, USDSGD, USDZAR, GBPAUD, GBPNZD (sell signal) see Weekly chart for more details. USDCAD, AUDUSD, AUDCAD, AUDCHF, AUDJPY, CHFJPY, NZDJPY, NZDUSD, NZDCAD, NZDCHFย  (buy signal) EURAUD, EURNZD,ย  USDSGD, GBPNZDย  (sell signal) see Daily chart for more details.

SCOPE FOR MON 26ย JUN 2019:

Bollinger Bands and Scalping Strategy (TUE 22:25 GMT):

The following pairs are currently forming spikes out of Bollinger Outer Bands. Signaling a SELL or BUY: USDCHF, EURGBP, USDJPY (buy signal) EURUSD, GBPUSD, AUDUSD, GBPJPY, AUDCAD, EURCAD, GBPCAD (sell signal) see Daily chart for more details.

SCOPE FOR MON 17THย JUN 2019:

Bollinger Bands and Scalping Strategy (SUN 19:15 GMT):

The following pairs are currently forming spikes out of Bollinger Outer Bands. Signaling a SELL or BUY: USDCHF,ย  USDCAD, EURGBP, EURAUD, EURNZD, GBPNZD, USDTRYย  (buy signal) GBPUSD, EURUSD, AUDCHF, GBPJPY, AUDJPY, NZDJPY, NZDUSD, NZDCAD, NZDCHFย  (sell signal) see Weekly chart for more details. GBPNZD, USDCAD , AUDNZD (buy signal)ย  ย GBPUSD, EURUSD, EURCHF, EURJPY, CADJPY, AUDJPY, NZDJPY, NZDUSD, XAUUSD, NZDCHF (sell signal) see Daily chart for more details.

SCOPE FOR 16THย MAY 2019 (WED 22:36ย GMT): The following pairs are currently forming spikes out of Bollinger Outer Bands. Signaling a SELL or BUY: USDJPY, AUDUSD, EURCHF, CHFJPY (buy signal) EURGBP, USDCAD (sell signal) see Daily chart for more details.

SCOPE FOR 15THย MAY 2019 (TUE 22:36ย GMT): The following pairs are currently forming spikes out of Bollinger Outer Bands. Signaling a SELL or BUY: CHFJPY, EURNZD (buy signal) GBPUSD, EURUSD, EURCAD, GBPSGD (sell signal) see Daily chart for more details.

SCOPE FOR 14THย MAY 2019 (MON 22:06ย GMT): The following pairs are currently forming spikes out of Bollinger Outer Bands. Signaling a SELL or BUY: USDCAD, EURGBP, CHFJPY, XAUUSD (buy signal) USDCHF, GBPUSD, USDJPY, AUDUSD, EURCHF, CADCHF, NZDCHF (sell signal) see Daily chart for more details.

SCOPE FOR 13THย MAY 2019 (SUN 20:58 GMT): The following pairs are currently forming spikes out of Bollinger Outer Bands. Signaling a SELL or BUY: EURGBP, EURJPY, CHFJPY, NZDUSD (buy signal) USDCHF, USDJPY, GBPCHF, NZDCHF (sell signal) see Monthly chart for more details. EURUSD, USDJPY, EURGBP, EURJPY, CADJPY, CHFJPY, NZDJPY (buy signal) USDCHF, USDCAD, GBPCHF, GBPAUD, GBPCAD, GBPNZD (sell signal) see Daily chart for more details.


Learn To Trade Pin Bars

Bollinger

Learn To Always Lock-In Your Profits


Bollinger

Referral links;

(Broker: Binary…https://record.binary.com/_WxWzztorkVi6tyDIijdDK2Nd7ZgqdRLk/1/)

(Broker: Alpari … ย  https://alpari.com/en/?partner_id=1244646)

(Broker: Exness โ€ฆ https://www.exness.com/a/t0q1u0q1)

(Broker: FXTMโ€ฆ http://forextime.com/?partner_id=4806145)

(Email: beanfxtrader@gmail.com)

(Telegram:ย  https://t.me/joinchat/KWBvKBDyn1nFB_3JQkR6GQ)

8 Replies to “Bollinger Bands and Scalping Strategy”

Leave a Reply

Your email address will not be published. Required fields are marked *